Hausse du niveau de la mer

Risques Naturels

Hausse du niveau de la mer

Préparé par le ICoD – Euro-Mediterranean Centre on Insular Coastal Dynamics (Valletta, Malta)

L’élévation du niveau de la mer peut être définie comme une augmentation de la surface de la mer en raison de l’élévation globale du niveau absolu de la mer dans les océans du monde ou d’une hausse relative par rapport à la masse terrestre (qui peut s’enfoncer ou être soulevée).

L’expression est populairement appliquée aux changements eustatiques anticipés du niveau des mers dus à l’effet de serre et le réchauffement climatique associé.

Sea level rise can be defined as a rise in the surface of the sea due to global-overall rise in absolute sea level in the world’s oceans, or relative-net rise relative to the local landmass (that may be subsiding or being uplifted). The expression is popularly applied to anticipated eustatic sea level changes due to the greenhouse effect and associated global warming.

Local mean sea level (LMSL) is defined as the height of the sea with respect to a land benchmark, averaged over a period of time (such as a month or a year) long enough that fluctuations caused by waves and tides are smoothed out. One must adjust perceived changes in LMSL to account for vertical movements of the land, which can be of the same order (mm/yr) as sea level changes. Some land movements occur because of isostatic adjustment of the mantle to the melting of ice sheets at the end of the last ice age. The weight of the ice sheet depresses the underlying land, and when the ice melts away the land slowly rebounds. Atmospheric pressure, ocean currents and local ocean temperature changes also can affect LMSL.

“Eustatic” change (as opposed to local change) results in an alteration to the ‘global’ sea levels, such as changes in the volume of water in the world oceans or changes in the volume of an ocean basin.

Sea level changes on a range of temporal and spatial-scales. The total volume of the ocean can change as a result of changes in ocean mass (addition of water to the ocean from the land) or expansion/contraction of the ocean water as it warms/cools.

In addition, the sea level does not change uniformly as water is added or taken away. There can be large regions of ocean with decreasing sea level even when the overall Global Mean Sea Level (GMSL) is increasing. Obviously there must be regions of ocean with trends correspondingly greater than the mean to balance out the regions with trends less than the mean. There are many processes that drive these changes.

Sea-level rise may occur due to short term / periodic changes (e.g. tides, waves, storm surges and seasonal variations), short-term geologic effects (e.g. earthquakes, subsidence) and longer-term sea level changes caused by mass exchange of water, thermal expansion and longer term geological effects. Global warming from increasing greenhouse gas concentrations is a significant driver of both increases in ocean mass and ocean thermal expansion as components of recent and future sea level rise.

A very brief history of sea level:

  • Over the last 140,000 years sea level has varied over a range of more than 120 metres. The most recent large change was an increase of more than 120 metres as the last ice age ended.
  • Sea level stabilised over the last few thousand years, and there was little change between about 1AD and 1800AD.
  • Sea level began to rise again in the 19th century and accelerated again in the early 20thCentury.
  • Satellite altimeter measurements show a rate of sea-level rise of about 3 mm/year since the early 1990s – a further increase in the rate is projected.

There are many factors which can produce short-term (a few minutes to 14 months) changes in sea level such as tides, waves, storm surges, earthquakes and seasonal variations. Table 1: Short term and periodic changes of sea level (http://en.wikipedia.org/wiki/Sea_level_rise)
Short-term (periodic) causes Time scale (P = period) Vertical effect
Periodic sea level changes
Diurnal and semidiurnal astronomical tides 12-24 h P  0.2-10- m
Spring tides Twice a month *
Rotational variations (Chandler wobble) 14 month P *
Meteorological and oceanographic fluctuations
Atmospheric pressure Hours to months  – 0.7 to 1.3 m
Winds (storm surges) 1-5 days Up to 5 m
Evaporation and precipitation (may also follow long-term pattern) Days to weeks
Ocean surface topography (changes in water density and currents) Days to weeks Up to 1 m
El Nino southern oscillation 6 months every 5-10 yr Up to 0.6 m
Seasonal variations
Seasonal water balance among oceans (Atlantic. Pacific. Indian)  * *
Seasonal variations in slope of water surface  * *
River runoff floods 2 months lm
water density changes (temperature and salinity) 6 months 0.2 m
Seasonal Seiches
Seiches (standing waves) Minutes to hours Up to 2 m
Earthquakes
Tsunamis (generate catastrophic long-period waves) Hours Up to 10 m
Abrupt change in land level Minutes Up to 10 m
* Effects change locally. Source: http://en.wikipedia.org/wiki/Sea_level_rise

A number of geological processes contribute to short-term changes in measured sea level. A few examples are:

  • earthquakes and other small-scale geological events
  • sinking of land (subsidence) through compaction of sediments and/or withdrawal of ground water
  • sinking of land through withdrawal of oil

On time scales of months and longer, sea level changes as a result of both changes in ocean mass (addition of water to the ocean from the land) and expansion/contraction of the ocean water as it warms/cools.

Exchange of water between « reservoirs » is an important contribution to sea level change. A significant part of this is through the hydrological cycle, where water evaporates from the ocean, resides in the atmosphere, then returns to the ocean either directly or via reservoirs (snow, ice, lakes, rivers, groundwater etc). There are both annual variations as well as longer-term variations. For example, extraction of water from underground aquifers can increase the mass of the ocean whereas the storage of water in dams can decrease the mass of the ocean.

Figure 1 Causes of sea level change (source: IPCC Third Assessment Report, 2001)

Contributions from non-polar Glaciers

A major contribution to sea level change is from the changing mass of glaciers, and the ice sheets. At the time of the last glacial maximum (140000 years ago) when sea level was more than 120 m below present level, there were major ice sheets in North American and northern Europe and Asia.

Several different estimates are proposed for the contribution of non-polar Glaciers by scientists. Kaser et al and others estimate the melting of glaciers and ice caps (excluding the glaciers surrounding Greenland and Antarctica) contributed to sea level rise by about 0.4 mm per year from 1961 to 1990 increasing to about 1.0 mm per year from 2001-2004. Another group of scientists, Meier et al, state that mass loss from glaciers is dominating the eustatic component of sea level rise in the 21st century, providing 1.1 mm/year of the total eustatic contribution of 1.8 mm/year in 2006. (Meier, M.F>, M.B. Dyurgerov, U.K. Rick, S. O’Neel, W.T. Pfeffer, R.S. Anderson, S.P. Anderson and A.F. Glazovsky (2007), Glaciers Dominate Eustatic sea level Rise in th 21st Century, Science, 317, 1064-1067).

Figure 2: The time series of glacier contributions to global sea level (top panel) and the cumulative effect (bottom panel) from 1961-2004. (source: Kaser, G., J.G. Cogley, M.B. Dyurgerov, M.F. Meier and A. Ohmura (2006), Mass balance of glaciers and ice caps: Consensus estimates for 1961-2004, Geophysical Research Letters, 33)

Contributions from the Ice Sheets

The ice sheets of Greenland and Antarctica have the potential to make the largest contribution to sea level rise, but they are also the greatest source of uncertainty. Since 1990 there has been increased snow accumulation at high elevation on the Greenland ice sheet, while at lower elevation there has been more widespread surface melting and a significant increase in the flow of outlet glaciers. The net result is a decrease in the mass of the Greenland ice sheet – a positive contribution to sea level rise. For the Antarctic Ice Sheet, the uncertainty is greater. There are insufficient data to make direct estimates for the preceding decades. At present, the mass gain of the Antarctic Ice Sheet due to increased thickening of the East Antarctic Ice Sheet does not appear to compensate for the mass loss due to the increased glacier flow on the Antarctic Peninsula and the West Antarctic Ice Sheet. Modelling studies suggest that the Antarctic Ice Sheet is still responding to changes since the last ice age and that this may also be contributing to sea level rise. (http://www.cmar.csiro.au/sealevel).

Figure 1 Antarctica surface elevation change (cm/year) Source: UNEP: Global outlook for Ice & Snow

Figure 1 shows rates at which the ice-sheet mass was estimated to be changing based on radar-altimeter data (black), mass-budget calculations (red), and satellite gravity measurements (blue). Rectangles depict the time periods of observations (horizontal) and the upper and lower estimates of mass balance (vertical). Measurements by satellite techniques based on gravity indicate mass loss at a rate of 138 ± 73 billion tonnes per year during 2002-2005, mostly from the West Antarctica Ice Sheet. That is equivalent to a rise in global sea level of 0.4 ± 0.2 mm per year, or 10-30% of the global rate measured since the 1950s, and is in good agreement with recent mass budget estimates.

Figure 1: Greenland surface elevation change (cm/year) Source: UNEP: Global outlook for Ice & Snow

Mass-balance estimates for Greenland show thickening at high elevations since the early 1990s at rates that increased to about 4 cm per year after 2000, consistent with expectations of increasing snowfall in a warming climate. However, this mass gain is far exceeded by losses associated with large increases in thinning of the ice sheet near the coast. Total loss from the ice sheet more than doubled, from a few tens of billions of tonnes per year in the early 1990s, to about 100 billion tonnes per year after 2000, with perhaps a further doubling by 2005. These rapidly increasing losses result partly from more melting during warmer summers, and partly from increased discharge of ice from outlet glaciers into the ocean. In particular, the speeds of three of Greenland’s fastest glaciers approximately doubled since 2000, although two of them have partially slowed since.

Ocean thermal expansion is one of the main contributors to long-term sea level change, as well as being part of regional and short-term changes. Water expands as it warms and shrinks as it cools.

From 1961 to 2003, the upper 700 metres of the global oceans absorbed about 3.6 x 10²¹ Joules per year, increasing global mean sea level (GMSL) by about 22 millimetres. This is equivalent to contributing about 0.52 mm/year to GMSL, and also to an air-sea flux of 0.36 Watts per square metre over the ocean area considered (65°S to 65°N). This contribution to GMSL is about one third of the total GMSL trend (1.6 mm/year) over this period.

From 1955 to 1995, earlier estimates of ocean thermal expansion is estimated to have contributed about 0.4 mm/year to sea level rise, less than 25 per cent of the observed rise over the same period. For the 1993 to 2003 decade, when the best data are available, thermal expansion was estimated to be significantly larger, at about 1.6 mm/year for the upper 750 m of the ocean alone, about 50 per cent of the observed sea level rise of 3.1 mm/year. (source: http://www.cmar.csiro.au/sealevel)

FIGURE

Figure 1: The top panel of the above plot show changes in the heat content of the top 700 metres of the ocean from 1960 to 2007. The bottom panel shows the change in thermosteric sea level. (http://www.cmar.csiro.au/sealevel)

One of the main long-term geological contributions to sea level is Glacial Isostatic Adjustment (GIA) – which is also known as Post-Glacial rebound (PGR). The ice sheets of recent ice ages compressed the earth’s mantle as they advanced causing the mantle to subside and also to squeeze material out in front of the ice sheet, producing what is known as the « forebulge ». Since the ice sheets retreated the mantle has been slowly returning towards its original configuration. This has produced the following effects:

  • regions which were under the ice sheets (e.g. much of northern Eurasia and North America) are rising – in some cases by up to 7mm/year.
  •  regions which were on the forebulge (e.g. the east coast of the U.S.) are sinking, typically at rates of 1mm/year or slightly more.
  •  regions further away are moving vertically at smaller rates as part of the overall adjustment that this causes. For example, Australia is rising at ~0.3-0.4 mm/year.

These effects contribute to changes in measured sea level through the vertical movements at tide gauge sites and also through the change in volume of the ocean basins as this long-term geological adjustment goes on.

Plate tectonics also contributes, but this is, generally, a much smaller effect.

Thermal expansion is producing about half of the current 3mm/year increase in global sea level. This contribution has increased from around 0.5 mm/year over the second half of the 20th century to around 1.6 mm/year over the last 12-14 years. This contribution is expected to continue at least at this level over the next century or more due to greenhouse-gas-induced warming of the atmosphere and ocean.

Due to the very patchy and sparse (especially as we go back in time) body of ocean temperature data that is available to estimate longer-term contributions, the contribution over most of the 20th century is hard to estimate reliably.

A major contribution to recent sea level rise is from the melting of glaciers, and contributions from the Greenland (both surface melting and iceberg calving and the Antarctic ice sheet (iceberg calving only). This is believed to produce about one third or more of the current 3mm/year annual increase in global sea level. The contribution from the ice sheets is poorly understood at the moment and is an active area of research. The melting of the Greenland ice sheet alone could increase global mean sea level by around 7 metres. This would probably take around 1,000 years, but it is believed that ice melt from Greenland could still contribute significantly to sea level rise over the next 50-100 years.

Globally

Global Mean Sea Level increased by 195mm between 1870 and 2004, and is continuing to rise at a fairly steady rate of just over 3mm/year. On average, it is expected that by 2100 sea levels will have risen in most places by around half a meter. In many places, 50 centimeters would see entire beaches being washed away, together with a significant portion of the coastline.

Locally

For people living on low-lying islands such as Tuvalu, Kiribati or the Maldives, where the highest point is only 2-3 meters above current sea levels, an extra 50 centimeters could see significant portions of their islands being washed away by erosion or covered by water. Even if they remain above the sea, many island nations will have their supplies of drinking water reduced because sea water will invade their freshwater aquifers. While these islands have sizeable populations, they’re insignificant compared to the tens of millions of people living in the low-level coastal areas of southern Asia. These include the coastlines of Pakistan, India, Sri Lanka and Burma. Densely populated areas like the Nile Delta and parts of Bangladesh would become uninhabitable, potentially driving hundreds of millions of people from their land. The sea level rise is exacerbated in some areas where large-scale land subsidence causes a rate of rise relative to the land which is substantially higher (e.g. Gippsland, Victoria and the Gulf coast of the U.S.). Correspondingly, some areas have seen less impact because they are rising. Australia is rising at about 0.3 -0.4mm/year due to Glacial Isostatic Adjustment (GIA), but is still starting to feel the effects.

A sea level rise of only a few meters would inundate thousands of square kilometers of highly populated and developed land. In Amsterdam, London, Rotterdam, Portsmouth or other low-lying coastal areas; communities, highways, factories, ports, railroads and many types of industry would be flooded.

The complete melting of Greenland would raise sea levels by 7 meters (23 feet). But even a partial melting would cause a one-meter (three-foot) rise. Such a rise would have a devastating impact on low-lying island countries which would be entirely submerged.

Sea level rise will be felt both through changes in mean sea level, and, perhaps more importantly, through changes in extreme sea level events.

Even if there are no changes in extreme weather conditions (for example, increases in tropical cyclone intensity), sea level rise will result in extreme sea levels of a given value being exceeded more frequently. This change in the frequency of extreme events has already been observed at many locations. The increase in frequency of extreme events will depend on local conditions, but events that currently occur once every 100 years could occur as frequently as once every few years by 2100. Even without the increase in the frequency of extreme events, millions of people will be impacted by the direct effects of sea level rise over the next century. The large changes in sea level over the last few ice ages are sometimes used to dismiss the importance of the relatively small current changes in sea level, on the grounds (apparently) that mankind adapted to these changes in the past, so it should be able to adapt again. The obvious fallacy in this argument is that, previously, the inhabitants of a region would have picked up all of their worldy goods and gone somewhere more suitable when changes of sea level made their current habitat untenable. With the massive infrastructure (e.g. London and New York) that are located near sea level and the many millions of people living in threatened regions (e.g. Bangladesh and southern Vietnam), such a solution is not available.

The physical effects of sea level rise can be classified as land loss due to inundation of low-lying areas and erosion of beaches and bluffs, salt intrusion into aquifers and surface waters, higher water tables, and increased flooding and storm damage.

Figure 6 Estimates of people flooded in coastal areas in the 2080s as a result of sea level rise and for given socio-economic scenarios and protection responses Source: UNEP: Global outlook for Ice & Snow

A rise of a few mm per year by the sea, although not threatening spectacular inundation is still extremely important. Direct land loss of low lying areas can rapidly (decadal to centennial periods) damage or destroy coastal ecosystems. Rising sea levels inundate wetlands and other low-lying lands, erode beaches, intensify flooding, and increase the salinity of rivers, bays, and groundwater tables. Some of these effects may be further compounded by other effects of a changing climate.

Coastal wetland ecosystems, such as salt marshes and mangroves are particularly vulnerable to rising sea level because they are generally within a few feet of sea level (IPCC, 2007). Wetlands provide habitat for many species, play a key role in nutrient uptake, serve as the basis for many communities’ economic livelihoods, provide recreational opportunities, and protect local areas from flooding.

As the sea rises, the outer boundary of these wetlands will erode, and new wetlands will form inland as previously dry areas are flooded by the higher water levels. The amount of newly created wetlands, however, could be much smaller than the lost area of wetlands – especially in developed areas protected with bulkheads, dikes, and other structures that keep new wetlands from forming inland. The IPCC suggests that by 2080, sea level rise could convert as much as 33 percent of the world’s coastal wetlands to open water. (IPCC, 2007). Tidal wetlands are generally found between sea level and the highest tide over the monthly lunar cycle. As a result, areas with small tide ranges are the most vulnerable.

In addition to inundation, long-term sea level rise can cause erosion and shoreline retreat by creating a sediment budget deficit. Coastal erosion is caused by a variety of factors, which broadly fall into two categories. First, sand often migrates along the shore, causing some areas to erode and others to accrete. Second, rising sea level causes virtually all shores to erode. Using a model first developed by Danish coastal engineer Per Bruun, coastal geologists have estimated that a one-meter rise in sea level will cause beaches to erode 50 to 100 meters from New England to Maryland, 200 meters along the Carolinas, 100 to 1000 meters along the Florida coast, and 200 to 400 meters along the California coast. These model calculations are roughly consistent with the observed rate of erosion. (http://www.cmar.csiro.au/sealevel)

The effect of rising mean sea levels will be felt most profoundly during extreme storm conditions when strong winds and falling pressure bring about a temporary and localised increase in sea level known as a storm surge. Storm surges occurring on higher mean sea levels will enable inundation and damaging waves to penetrate further inland increasing flooding, erosion and the subsequent detrimental impacts on built infrastructure and natural ecosystems. In the tropics storm surges are caused by tropical cyclones while elsewhere mid-latitude storms and their associated cold fronts are the main cause of storm surges.

Sea level rise also increases the vulnerability of coastal areas to flooding during storms for several reasons. First, a given storm surge from a hurricane or northeaster builds on top of a higher base of water. Considering only this effect, it is estimated that existing development in the U.S. Coastal Zone would experience a 36-58 percent increase in annual damages for a 30 cm rise in sea level, and a 102-200 percent increase for a 1 m rise. Shore erosion also increases vulnerability to storms, by removing the beaches and dunes that would otherwise protect coastal property from storm waves (FEMA 2000). Sea level rise also increases coastal flooding from rainstorms, because low areas drain more slowly as sea level rises.

Other impacts of climate change may further enhance or mitigate coastal flooding. Flooding from rainstorms may become worse if higher temperatures lead to increasing rainfall intensity during severe storms. An increase in the intensity of tropical storms would increase flood and wind damages.

Rising sea level increases the salinity of both surface water and ground water through salt water intrusion. If sea level rise pushes salty water upstream, then the existing water intakes might draw on salty water during dry periods. Salinity increases in estuaries also can harm aquatic plants and animals that do not tolerate high salinity. Shallow coastal aquifers are also at risk (IPCC, 2007). As rising water levels submerge low-lying portions of the coastal areas, portions of the aquifers would become saline.

All the mentioned impacts of sea level rise can cause human loss due to increased level of storm surges, socio-economic losses of coastal communities as well as impact on national economies, environmental problems such as loss of wetlands, dunes and associated ecosystem habitats and loss of cultural heritage due to inundation of these sites (http://epa.gov/climatechange/effects/coastal/index.html).

Measures that people take to protect private property from rising sea level may have adverse effects on the environment and on public uses of the coast in general and more specifically beaches and waterways. Historically, along sandy bay beaches, property owners have erected various types of sea walls to halt erosion. Although these hard structures protect property, they can eliminate bay beaches, which are usually less than 3 m wide. In addition to their environmental and shoreline protection function, beaches are high income generating resources through attraction of tourism and also used for fishing, recreation, transportation, and landing of small crafts.

The sinking of land by compaction of sediments through human development activities and/or withdrawal of ground water and/or oil, significantly contributes to sea level rise and its consequences.

Many of the impacts of sea level rise are directly influenced by human activities along coastal areas such as building dams along rivers that decrease sediment supplied to coastal areas and increasing the possibility of coastal erosion. Excessive use of groundwater related with land use, increases the vulnerability of freshwater resources to sea level rise. Degradation of natural coastal protection structures such as dunes and mangrove forests (through coastal excavation / construction) also influences the consequences of sea level rise in an adverse way by reducing the natural protective function offered by such structures.

The driving force behind recent sea level rise is global warming and climate change. As research shows, the main cause of global warming is the increased concentration of greenhouse gases in the atmosphere which is caused by human activities. So we can say that the causes of sea level rise are mainly influenced by human activities.

However this also means that we can eliminate these causes by taking action. To minimize the impacts of climate change, we need to start changing our habits as soon as possible to decrease the amount of greenhouse gas emissions.

Sea-level rise is a central element in detecting, understanding, attributing and correctly projecting climate change. During the 20th century, the oceans have stored well over 80 per cent of the heat that has warmed the earth. The associated thermal expansion of the oceans, together with changes in glaciers and ice caps, will likely dominate 21st century sea level rise. However, there is increasing concern that the contribution from melting of the ice sheet may be larger than previously estimated, and on longer time scales, the ice sheets of Greenland and Antarctica have the largest potential to contribute to significant changes in sea level.

During the 21st century, sea level will continue to rise due to warming from both past (20th century and earlier) and 21st century greenhouse gas emissions. The most robust projections of 21st century sea-level rise are the Assessments of the Intergovernmental Panel on Climate Change (IPCC) of 2001 and 2007.

In its 2007 assessment of global warming, the Intergovernmental Panel on Climate Change (IPCC) projected that global mean sea level is expected to rise between 0.18 to 0.59 meters (0.6 and 2 feet) in the next century.

Figure 7 Sea Level Change (source: IPCC, 2007)

Estimates of the ocean thermal expansion are made with coupled climate models for the range of SRES greenhouse gas emission scenarios. Recent estimates indicate that non-polar glaciers and ice caps may contain only enough water to raise sea level by 15 to 37 centimetres (Lemke et al. 2007). The largest contribution is from large glaciers in regions with heavy precipitation, such as the coastal mountains around the Gulf of Alaska, or Patagonia and Tierra del Fuego in South America. Many of these glaciers flow into the sea or large lakes and melt quickly because the ice is close to melting temperature.

For Greenland, both glacier calving and surface melting contribute to mass loss. Over the last few decades surface melting has increased and now dominates over increased snowfall, leading to a positive contribution to sea level during the 21st century. For the majority of Antarctica, present and projected surface temperatures during the 21st century are too cold for significant melting to occur and precipitation is balanced by glacier flow into the ocean. (Lemke et al. 2007).

In addition to these surface processes, there are suggestions of a potential dynamical response (sliding of the outlet glaciers over the bedrock) of the Greenland and Antarctic ice sheets. In Greenland, there was a significant increase in the flow rate of many of the outlet glaciers during the early 21st century. One potential reason for this is increasing surface melt making its way to the base of the glaciers, lubricating their flow over the bed rock, consistent with increased glacier flow rates. Another effect which may be becoming more important is that, as the ice shelves around Antarctica and Greenland melt or break up (e.g. Larsen B) they allow the glaciers behind them to flow faster, leading to increased flow into the ocean.

When projecting future sea-level rise, we need to recognise that local trends related to decadal variability will be superimposed on the slowly increasing global-mean sea level. At this stage there is no agreed pattern for the longer-term regional distribution of projected sea-level rise. There are, however, several features that are common to most model projections – for example a maximum sea-level rise in the Arctic Ocean and a minimum rise in the Southern Ocean south of the Antarctic Circumpolat current.

Figure 8 The multi-model mean of the departure of the projected regional sea-level rise from the global-averaged (SRES A1B) projections for 2030 and 2970 (source: http://www.cmar.csiro.au/sealevel)

For the next few decades, the rate of sea-level rise is partly locked in by past emissions, and will not be strongly dependent on early 21st century greenhouse gas emission. However, sea level projections closer to and beyond 2100 are critically dependent on future greenhouse gas emissions, with both ocean thermal expansion and the ice sheets potentially contributing metres of sea-level rise over centuries for higher greenhouse gas emissions.
Present day contributions from the Greenland come from both surface melting and iceberg calving and for the Antarctic ice sheet from iceberg calving only. The contribution from the ice sheets is poorly understood at the moment and is an active area of research.

In the case of the Greenland Ice Sheet, if global average temperatures cross a point that is estimated to be in the range of 1.9°C to 4.6°C above pre-industrial values, surface melting is likely to exceed precipitation (Gregory and Huybrechts, 2006). The inevitable consequence of this is an ongoing shrinking of the Greenland Ice Sheet over a period of centuries and millennia. Total melting of the Greenland ice sheet alone would increase global mean sea level by around 7 metres. This conclusion is consistent with the observation that global sea level in the last interglacial, when temperatures were in this range, was several metres higher than it is today. This threshold (of melting exceeding precipitation) could potentially be crossed late in the 21st century.

Dynamic responses of the Greenland and/or West Antarctic Ice Sheets (sliding of the ice sheets over bedrock) could lead to a significantly more rapid rate of sea level rise than from surface melting alone. There is increasing evidence that this dynamic response may be occurring. (http://www.cmar.csiro.au/sealevel)

It is difficult for scientists to be more precise with sea-level projections because there are a number of uncertainties:

  • Greenhouse gas concentrations

While scientists agree that the levels of greenhouse gases are rising, future increases depend on many factors, including population growth, energy use and the development of new technologies.

  • Climate sensitivity

Climate sensitivity is the amount of atmospheric warming that results from a doubling of atmospheric carbon dioxide concentrations. It depends on the presence of greenhouse gases, and on feedback processes from clouds, water vapour and ice. This is a significant source of uncertainty in projections of long-term climate change.

  • Ocean heat exchange

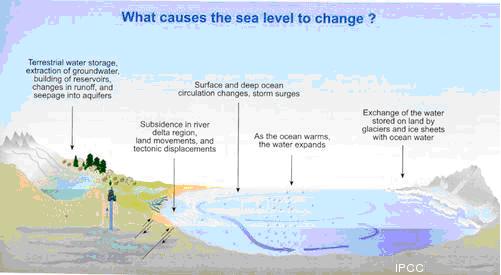
Heat moves between the atmosphere and the ocean’s surface. The temperature at the surface at any one time is influenced by what is going on in the ocean. Quite small changes in the transport of heat or salt can have large effects on surface temperature, and ultimately on climate. Ocean models have developed rapidly over the last two decades but accurately representing the most important ocean features remains a challenge.

  • Ice

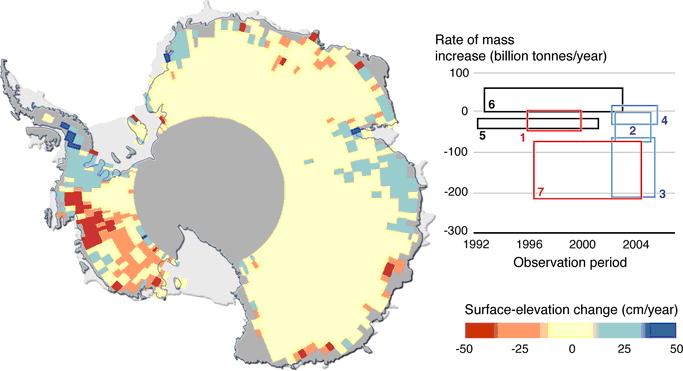
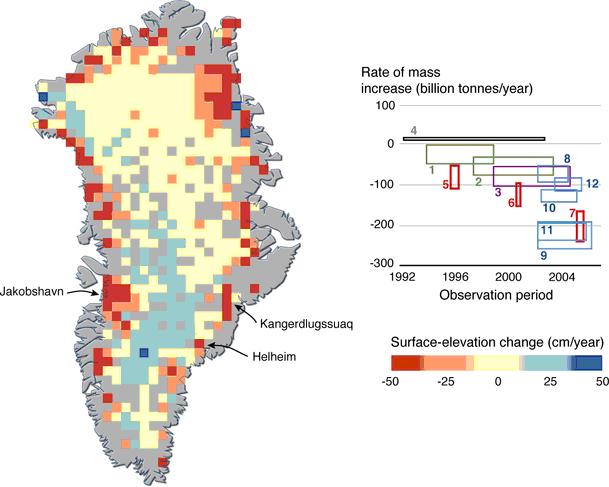
There is uncertainty about the response of the ice sheets in Greenland and Antarctica to hundreds of years of warmer temperatures. Scientists are concerned that there could be a rapid disintegration of the West Antarctic ice sheet, causing a rapid rise in sea level.
(source: http://science.org.au/nova/082/082key.htm).

It is highly likely that even if greenhouse gas emissions could be stabilized by the end of the 21st century, sea-level rise from ocean thermal expansion may only have reached half its eventual level by the year 2500.

However, the damage may be minimized if we start taking action right now! Both by implementing measures to minimize the greenhouse gas emissions and adapting the environment and life styles, we can decrease the impacts of negative consequences of sea level rise.

Future planning should take global warming and consequent sea-level rises into consideration in order to ensure adaptation of coastal communities to consequences of sea level rise. For example, building protective sea walls and restricting coastal development in areas at risk, are planning measures that could minimize damage from rising sea levels over the next century. Property owners and federal, state, and local governments are already starting to take measures to prepare for the consequences of rising sea level. Some coastal communities place sand onto their beaches to offset shore erosion. Property owners are elevating existing structures in many low-lying areas, encouraged by lower flood insurance rates.

Coastal cities should adopt policies to ensure that beaches, dunes, or wetlands are able to migrate inland as sea level rises. Some states prohibit new houses in areas likely to be eroded in the next 30-60 years.

In terms of salinisation of fresh water resources, water management authorities currently prevent excessive salinity by releasing fresh water from reservoirs during droughts. One possible response to sea level rise would be to store more water during wet seasons so that more water can be released during droughts. However, other water management goals (e.g. flood prevention) may make it difficult to save extra water for the occasional drought. The impacts of climate change on local hydrology may offset or increase salinity increases due to sea level rise.

Sea level rise is a very slow process if one thinks in terms of days, months or even years. Thus, what should be done at locations where sea level rises, is mostly to be prepared for the consequences of sea level rise. Adaptation is the most important action to be taken in order to minimize any type of loss in the future.

Other than adaptation, measures to mitigate global warming and climate change should be integrated to present national policies and our ways of living. There are several awareness raising projects trying to inform public on the measures to be taken to lower the greenhouse gas emissions such as switching to alternative energy resources other than fossil fuels, insulating our houses to decrease the excess use of energy, walking rather than using cars, etc.

Maps are important tools for planning of adaptation measures of coastal areas and communities. Different types of maps inform us on the level of impacts of sea level rise on the coastal areas such as inundation maps which show the areas which will be permanently under the sea level according to different sea level rise scenarios. One example of this type of maps can be found at the http://flood.firetree.net/ website showing areas of the Netherlands and UK that would be flooded at various stages of sea level rise. You can select a value of sea level rise using the dropdown box in the upper left corner of the map. The navigation buttons can be used to zoom in/out and pan across the map.

There are also vulnerability maps which show the coastal regions, coastal habitats or coastal communities ranked according to their vulnerabilities to impacts of sea level rise. These maps are important and necessary for adaptation planning of coastal areas since they give information about different factors which will be affected by sea level rise while the maps mentioned above are the results of specific scenarios which might happen in the future.

For vulnerability maps, different types of models are developed and used for different objectives. For example, the BRANCH project supported by EU funds (2008-2009) demonstrated the vulnerability of coastal habitats to sea level rise (Figure 1).

Figure 1: Salt marsh vulnerability levels (source: http://www.branchproject.org)

Another example of mapping vulnerability of coastal areas to sea level rise has been performed in Goksu Delta, Turkey as an example of vulnerability of deltas, which are to be most affected low lying lands along the coasts both physically and socio-economically. Using both human and physical impacts, the vulnerability map shows that Goksu Delta is mostly moderately vulnerable to sea level rise. But the settlement areas are highly vulnerable to impacts of sea level rise. These types of maps enable decision makers to determine the areas which need protection in terms of adaptive management policies and/or coastal protection structures. (Ozyurt and Ergin, 2009).

Figure 2: Vulnerability map of Goksu Delta, Turkey(Ozyurt and Ergin, 2009)